
Don’t miss the full story, whose reporting from Anne Jolly at The Associated Press is the basis of this AI-assisted article.
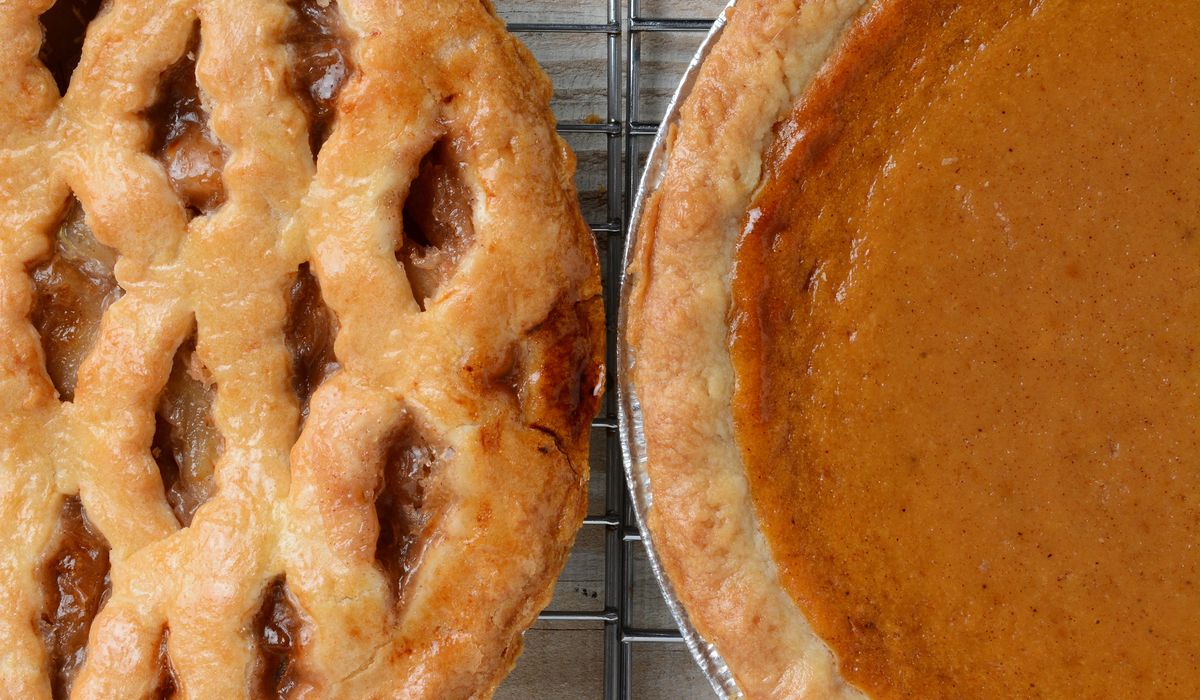
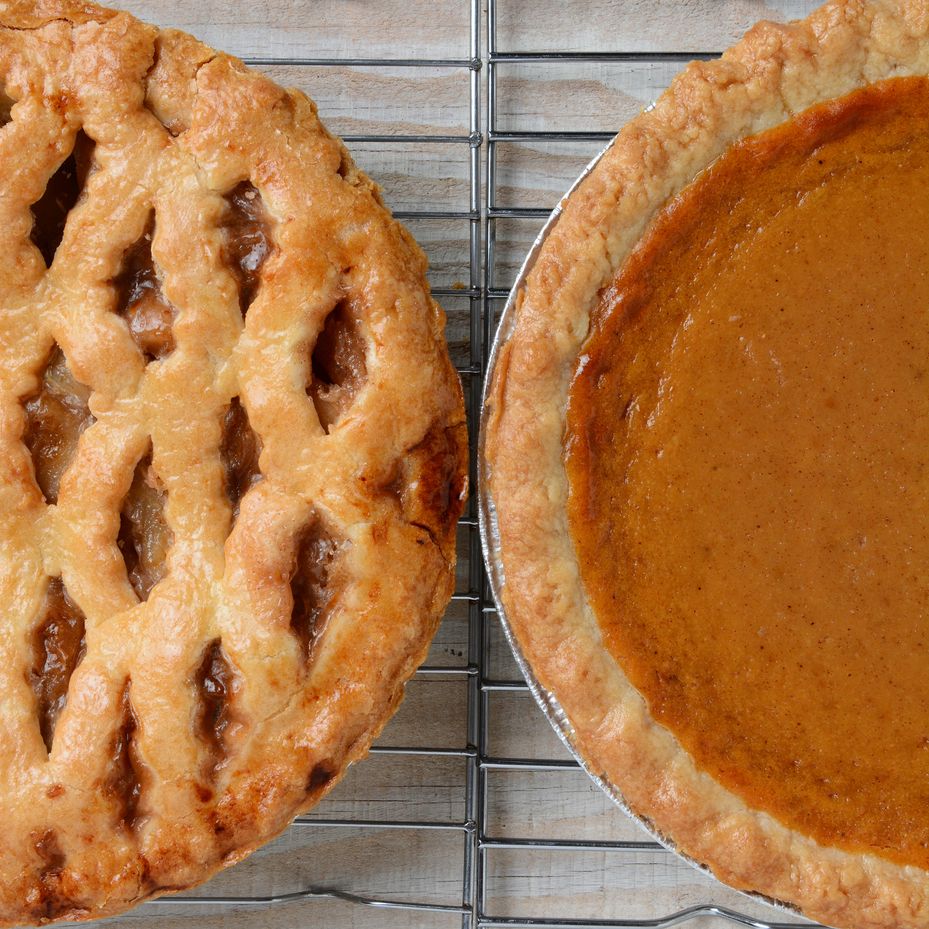
The great Thanksgiving pie debate between apple and pumpkin reveals that while apple pie dominates year-round sales with 29% of purchases, pumpkin pie claims the holiday throne with 29% of Americans choosing it as their favorite Thanksgiving dessert.
Some key facts:
• Instacart’s 2024 data shows apple pies captured 29% of year-round pie purchases compared to pumpkin’s 23%.
• YouGov’s Thanksgiving-specific poll found pumpkin pie won with 29% of the vote while apple pie received only 20%.
• Apple pie is more popular in the Northeast, while pumpkin pie dominates in the Midwest and South.
• Approximately 57% of American households planned to serve pumpkin pie for Thanksgiving, while 43% planned to serve apple pie.
• More than half of all Americans plan to finish their Thanksgiving dinner with a slice of pie.
• Pumpkin pie appears seasonally from late October through December, creating anticipation through its limited availability.
• U.S. soldiers in World War II told journalists they were fighting “for mom and apple pie,” cementing apple pie’s status as an American symbol.
• Native Americans grew pumpkins for thousands of years and taught European settlers how to use them, giving pumpkin pie deep historical roots in American harvest traditions.
READ MORE: Apple and pumpkin face off for America’s favorite holiday pie
This article is written with the assistance of generative artificial intelligence based solely on Washington Times original reporting and wire services. For more information, please read our AI policy or contact Ann Wog, Managing Editor for Digital, at awog@washingtontimes.com
The Washington Times AI Ethics Newsroom Committee can be reached at aispotlight@washingtontimes.com.